Statistics in R Programming: How to make analysis in R, by usising statistical evidance.
Skills
Author
Benjamini Mpinga
Published
April 20, 2023
Statistics Leson 1.
Statistics is a branch of Maths that deals with every aspect of the data/ Also Statistics can be refereed as a knowledge for collecting, analyzing and interpreting data. Statistics can be used to predict the future, determine the probability that a specific event will happen, or help answer questions about a survey. Statistics is used in many different fields such as business, medicine, biology, psychology and social sciences. Statistical knowledge helps to choose the proper method of collecting data and employ those samples in the correct analysis process in order to effectively produce the results. In short, statistics is a crucial process which helps to make the decision based on the data.
What is Statistics in Programming?
In Mathematics, statistics concerns the collection of data, organisation, interpretation, analysis and data presentation. An example of statistical analysis is when we have to determine the number of people in a town who watch TV out of the total population in the town. The small group of people is called the sample, which data is taken from them.
descriptive, which focuses on summarizing data. Inferential, which focuses on making conclusions based on samples and Inferential Statistics Based on the data sample taken from the population, inferential statistics makes the predictions and inferences. Both types of statistics are equally employed in the field of statistical analysis..
The characteristics of Statistics are a:
Statistics are numerically expressed.
It has an aggregate of facts
Data are collected in systematic order
It should be comparable to each other
Data are collected for a planned purpose
The importance of statistics are…
Statistics helps in gathering information about the appropriate quantitative data
It depicts the complex data in graphical form, tabular form and in diagrammatic representation to understand it easily
It provides the exact description and a better understanding
It helps in designing the effective and proper planning of the statistical inquiry in any field
It gives valid inferences with the reliability measures about the population parameters from the sample data
It helps to understand the variability pattern through the quantitative observations
Why is statistics vital?
Statistics is an important field because it helps us understand the general trends and patterns in a given data set. Statistics can be used for analyzing data and drawing conclusions from it. It can also be used for making predictions about future events and behaviors. Statistics also help us understand how things are changing over time. The main purpose of using statistics is to plan the collected data in terms of experimental designs and statistical surveys. Statistics is considered a mathematical science that works with numerical data.
What are the uses of statistics in real life?
Statistics is an integral part of our lives. It is used in the workplace and everyday life. In the workplace, statistics are often used to analyse what works best for a company’s marketing strategy or how to distribute work among employees. In daily life, statistics can be used to analyse what food you should buy at the grocery store or how much money you spend on purchasing each week. Statistics are everywhere, and they help us make sense of the world around us.
Concept covered in Statistics.
The most important concepts covered in Statistics include - mean, - median - mode - range - standard deviation - Normality and - Significance. Mean and Median in statistics usually measure the median/mean value, but their application depend on the sample’s nature.
Descriptive Statistics.
Descriptive statistics usually used to describe type of data, by describe Median, Mean, Mode and Range in a particular data. The mean is the average of the data set. The median is the middle of the set of numbers, The mode is the most common number in a data set. In these three the mean is the only one that requires formula. Mean in math is what called Average, they are synonym.
How to find Median.
To calculate median value when your data values are mostly alike but some few values have big difference from the other either High or Low. The purpose is to avoid the high or low values to affect the result. Basically for numeric data. (1,2,3,4,5,6,7) to find median. you arrange your numbers from the lowest to the highest or from highest to the lowest then you pick the centered number. So in the set 1, 2, 3, 4, 5, 6, 7 the middle number is 4.
But what happens if the data set is like (1, 2, 3, 4, 5, 6, 7, 8)? in that case you arrange your data set and then you add the two middle numbers and then you them divide by 2, (4 + 5 = 9/2 = 4.5). In most cases the median and the mean are likely to have the same value, even when they differ, it’s not in ignificance gap.
How to find mean.
There are mainly two ways to find mean in a data set, One is by finding the sum of the values by adding them all up, dividing the sum by the number of values in the data set. Eg. (1, 2, 3, 4, 5, 6, 7) to find mean …… 1 + 2+ 3 + 4 + 5 + 6 + 7= 28/7 = 4 therefor the mean is 4. Remember the mean in a data set does not have to appear in the data set.**
The different between Mean and Median
The median is less affected by outliers and skewed data, is used for skewed distributions.
Median is Usually the preferred measure of central tendency, when distribution is not symmetrical.
The mean is usually used for normal distributed data.
Standard deviation
You have to calculate the deviation in order to measure where your data deviate from the normal value.
Statistics lesson 2.
As we have seen in previous lesson, statistics plays major roll to daily life activities, therefor knowing how to apply statistics in analysis, is not only basic knowledge to acquire but also essential tool to approach and solve some analytic data based questions. So in this lesson we shall focus on the second type of statistics, which often used to transform, analyze and give analytic results, to support decision making. Inferential statistics help to solve many problems which require analytics approach, and scientific based evidence. So if you want to become a data analyst or a good researcher, then this angle is where you should focus attentively.
Inferential Statistics for numeric data.
While descriptive statistics used to describe type of data, and describe Median, Mean, Mode and Range in a particular data. Then Inferential statistics focus on solutions, or in other word, when Data rise challenges or questions, it’s inferential type of statistic which solve and answer those challenges and questions.
Data collection theory.
Begin with sample collection, it is advise to collect at least 10 to 30 percent samples of general population, this is to ensure samples can provide accurate results. This is due to fact that, the less ample you collect the less efficient result you may get, also the more sample you collect might be unnecessary sometimes, this means it might not make any different in results. So it is advice to collect a reasonable samplesize for better utilization of resources and time management.
Hypothesis Theory.
Hypothesis means the basic assumptions rouse by a researcher or a data annalist, which support or give reasons for Him/Her to conduct a research, or to collect a particular data to clear His/Her doubt. So every researcher always have most common expected result in His/Her assumptions, But whatever results which are assumed to be true or false, are what called Hypothesis.
There are two types Hypothesis.
Null Hypothesis – Ho – Negative.
Alternative Hypothesis – Ha – Positive :::
Often data are collected by researcher(s), who focus on a specific matter or subject, So there are some steps to consider before going field for data collection. Begin by setting your project plan, including project tile and objectives, then finally to rise hypothesis. Now in professional standard, the Hypothesis which used to finalize the research conclusions is Null Hypothesis – Ho – Negative. In statistic analysis, we use different approach to address solutions to our questions, A requires standard approach in statistical analysis, is to test the significance and Insignificance of the data results, and the normality of data distributions. Therefor to be sure about data conclusions, then you have to test data normality, and the significance and Insignificance of the results.
Test significance and Insignificance.
Null hypothesis theory = No significant difference.
Alternative Hypothesis Theory = There is significant difference.
Null hypothesis theory, is usually used to conclude results of the research, and to measure the significance of the results, as well as to measure the normality of data distributions, so many research conclusions are made by using this theory. So the significant level and Normality both are measured by P value.
Formula to measure significance of data results.
In the case of measuring significance of the results we refer to the formula…
when the P value = > 0.05 then it’s considered There is No significant difference. And
when the P value = < 0.05 then it’s considered There is significant difference.
Test Normality Formula.
Null Hypothesis - Ho = Is normal distributed. while
Alternative Hypothesis - Ha = Is not normal distributed.
Normality refers to the distribution of your collected data, this means after you have describe your data in descriptive type of statistics, then you have to test them, if they are normal distributed or not normal distributed. In normality formula we prescribe the P level formula other way round, which means,
Normality formula.
In the case of measuring normality of data distributions we refer to the formula that…
When P value = > 0.05 then you Accept the Null.
When P value = < 0.05 then you Reject the Null.
Test Normality in R.
In R, we test the distributions of the data by using the function (shapiro), the below example is how you can test the distribution of the data in R analysis. The data we are using is auto generated from R database. In R you can find some data to help you improve your analysis practice, in case you don’t have access to acquire data from other source. to generate data in R, just create a chunk then write iris then run the chunk, and data will appear on your R editor. After that you can equate them to another name.
require(tidyverse)
Loading required package: tidyverse
-- Attaching core tidyverse packages ------------------------ tidyverse 2.0.0 --
v dplyr     1.1.1     v readr     2.1.4
v forcats   1.0.0     v stringr   1.5.0
v ggplot2   3.4.2     v tibble    3.2.1
v lubridate 1.9.2     v tidyr     1.3.0
v purrr     1.0.1
-- Conflicts ------------------------------------------ tidyverse_conflicts() --
x dplyr::filter() masks stats::filter()
x dplyr::lag()    masks stats::lag()
i Use the conflicted package (<http://conflicted.r-lib.org/>) to force all conflicts to become errors
sample.iris=iris
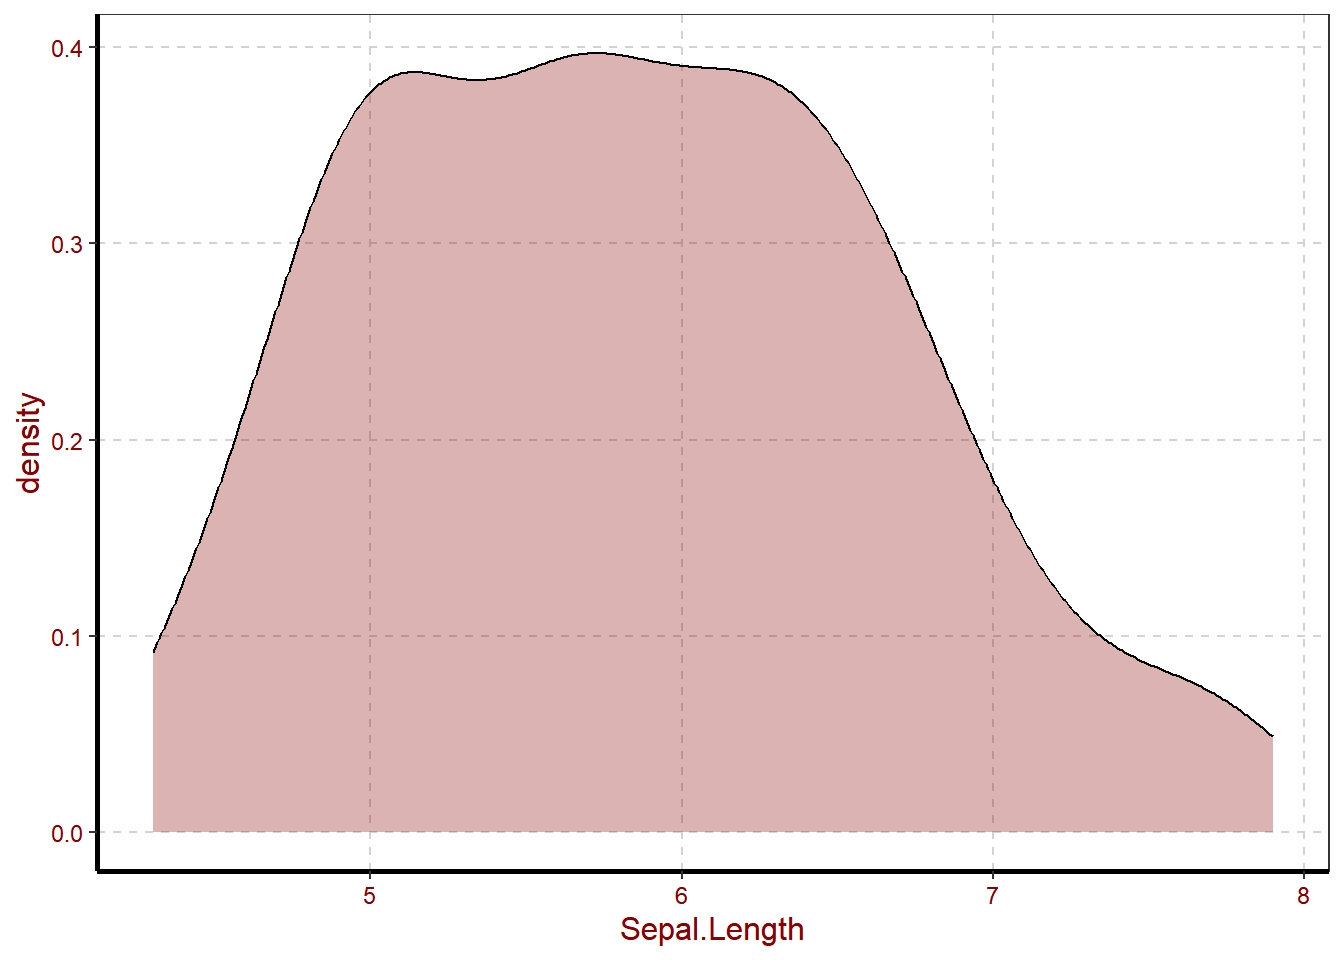
sample.iris$Sepal.Length %>%shapiro.test()
    Shapiro-Wilk normality test

data:  .
W = 0.97609, p-value = 0.01018
we have tested Sepal.L data normality in R, and results shows that the are not normal distributed. Then we have tried to plot in order to observe visual distribution, and results still shows that Sepal.Length are not normal distributed.
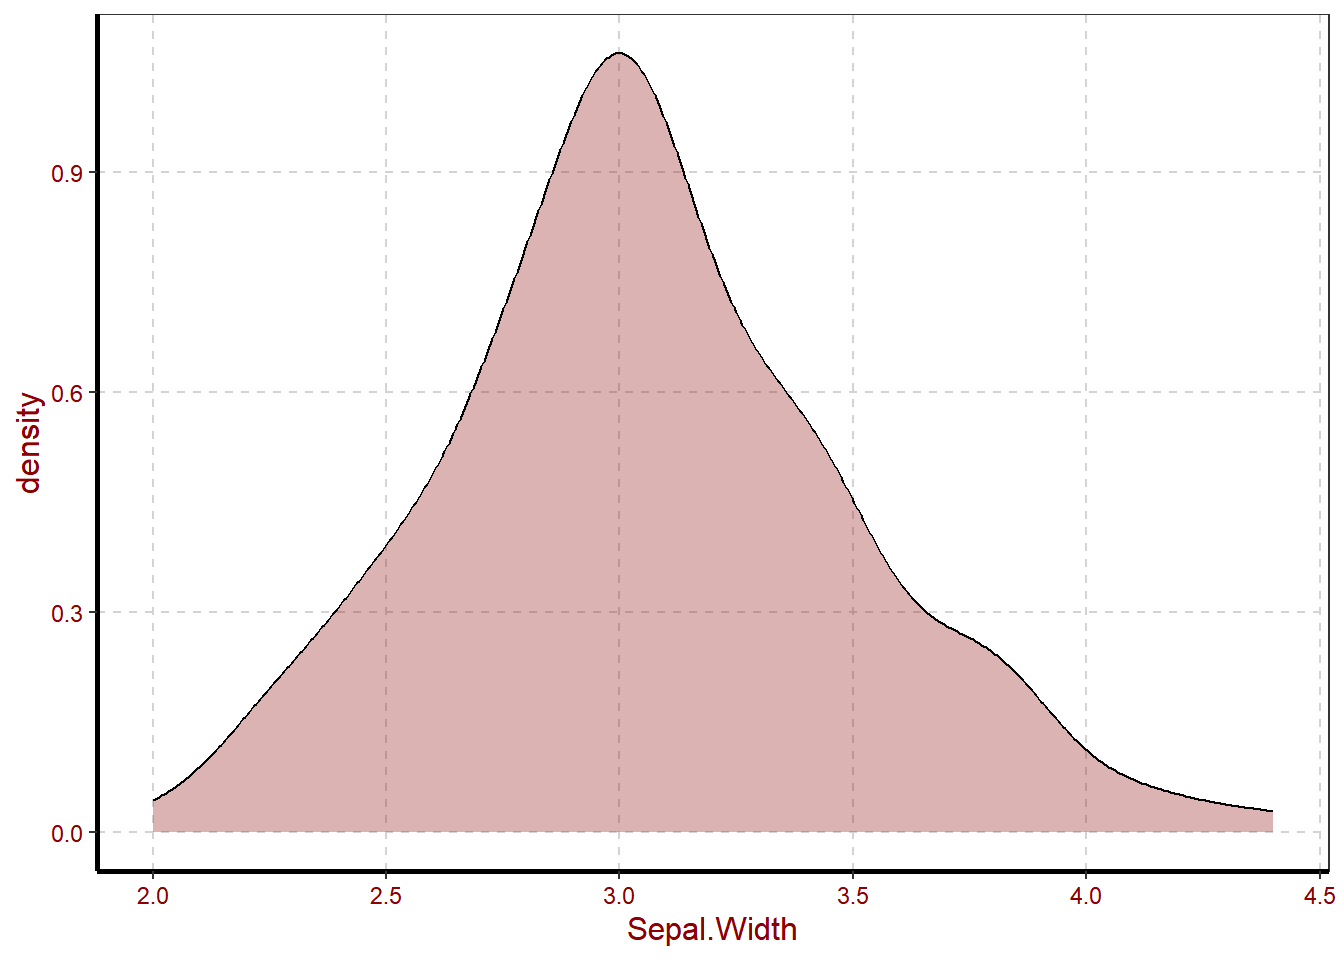
sample.iris$Sepal.Width %>%shapiro.test()
    Shapiro-Wilk normality test

data:  .
W = 0.98492, p-value = 0.1012
we have tested Sepal.Width data normality in R, and results shows that they are normal distributed. Then we have tried to plot in order to observe visual distribution, and results still shows that Sepal.Width are normal distributed.
This is how we test data in R programming language, it is easier and clear as we have seen. S o working your data in R, is not only a recommended tool but also facilitate mass data solutions.
CENTRAL LIMIT THEORY (CLT)
In statistics the central limit theory means the value on which majority of population falls. It simply states that The distribution approaches normal, as the samples get larger. therefor it is recommended that to attain doubtless results you are required to collect at least >= of 30% samples of the population. This theory of central limit usually shown through continuous plots such as Histogram and density. This is due to their nature. On the figure below we are going to see the example of central limit theory in visualization.
In this study we will see how statistics works in real life, and how useful it is in every day’s decision making. By applying a proper and correct method in collecting/recording samples, analyzing, interpreting and sharing of findings is always a best way to reach the right decisions, especially for decision makers, weather in family level.
What is the purpose of dispersion
The purpose is to find out how spread out the data values are, on the number line, the deference between the maximum and the minimum value is the formula to measure dispersion (Measure of spread).
What does it mean by Measure of central tendency
Simply is defined as A measure that identifies a single value as representative of the entire distribution. It is the single value that is most typical/representative of the collected data.
Related pots
Stay in touch
If you enjoyed this post, then don't miss out on any future posts by subscribing to my email newsletter
Support my work by sharing the link or by contact through +255 768 596 017.